It takes more than a good eye to spot differences in XML documents

Here at DeltaXML we’re always looking to make additional improvements to our products, because we always want to make sure we provide our customers with the best quality features for managing change in XML content. In the last months, major releases of our flagship product, XML Compare, have come with improved performance – up to 40% faster – and a complete overhaul to the way we compare content held in the CALS table model. Our latest major release, version 13.0, builds upon these improvements with a great new feature – SVG comparison!

The popularity of SVGs

Scalable Vector Graphics (SVG) is an open XML standard created and developed by the World Wide Web Consortium (W3C) for specifying two-dimensional images, supporting interactivity and animation. ‘Scalable what now?’, you might ask. Well, SVG is a vector-based image, so it describes the geometry of the lines and shapes in the image rather than specifying the colour of each pixel in a grid as a bitmap image does. This means that when you change its size, or scale it, it still displays as it should and doesn’t become pixelated. This is really useful for responsive websites where the content creator needs to cater to the fact that users could view the site on a range of different devices.

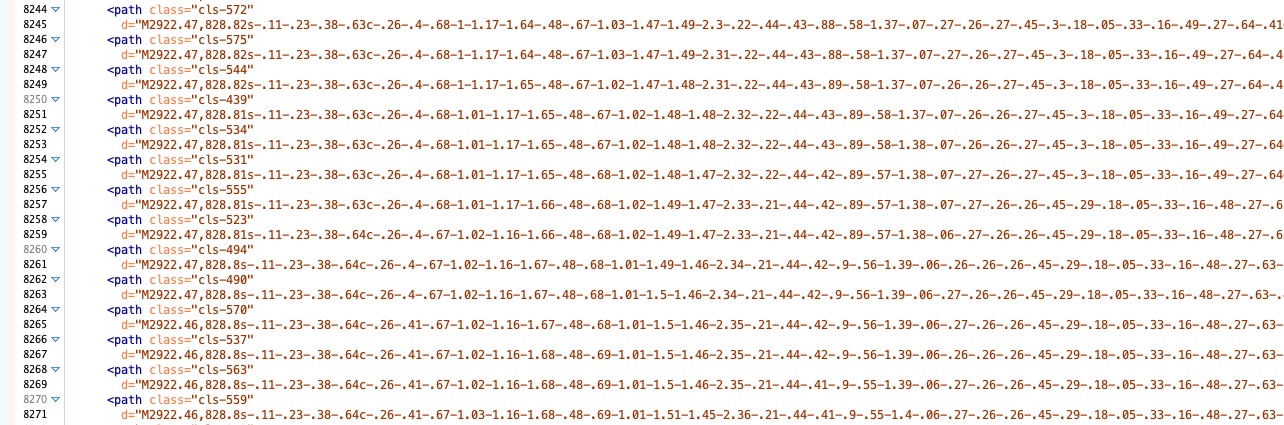
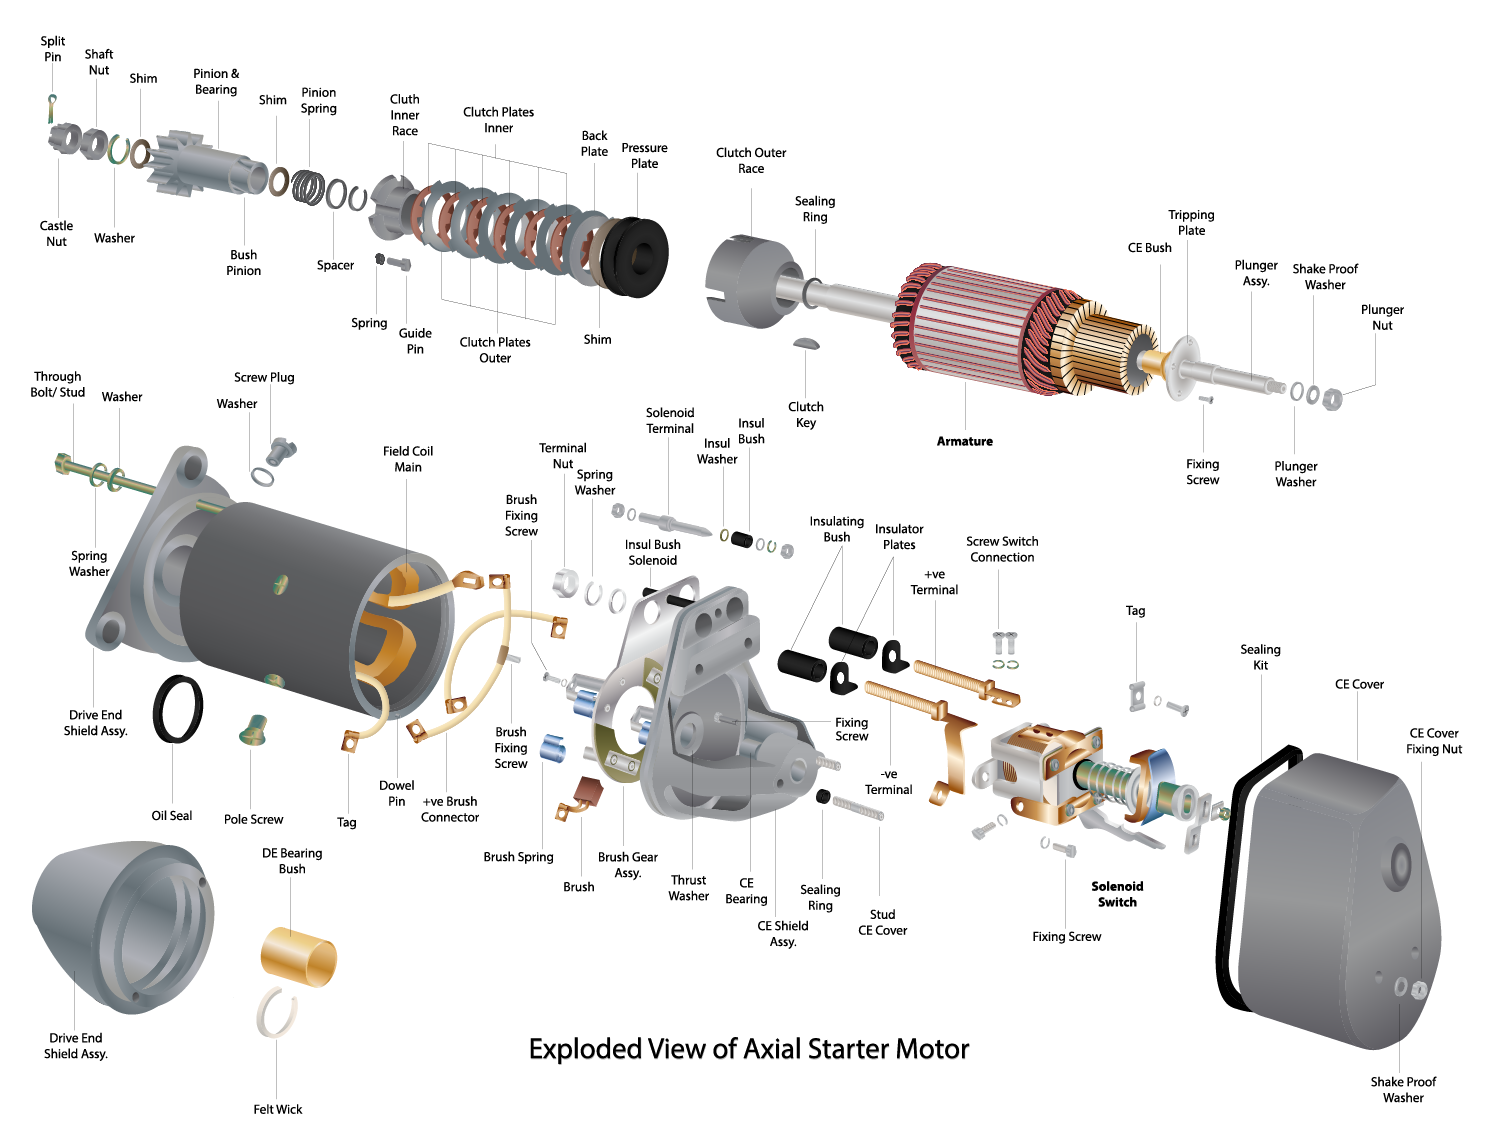
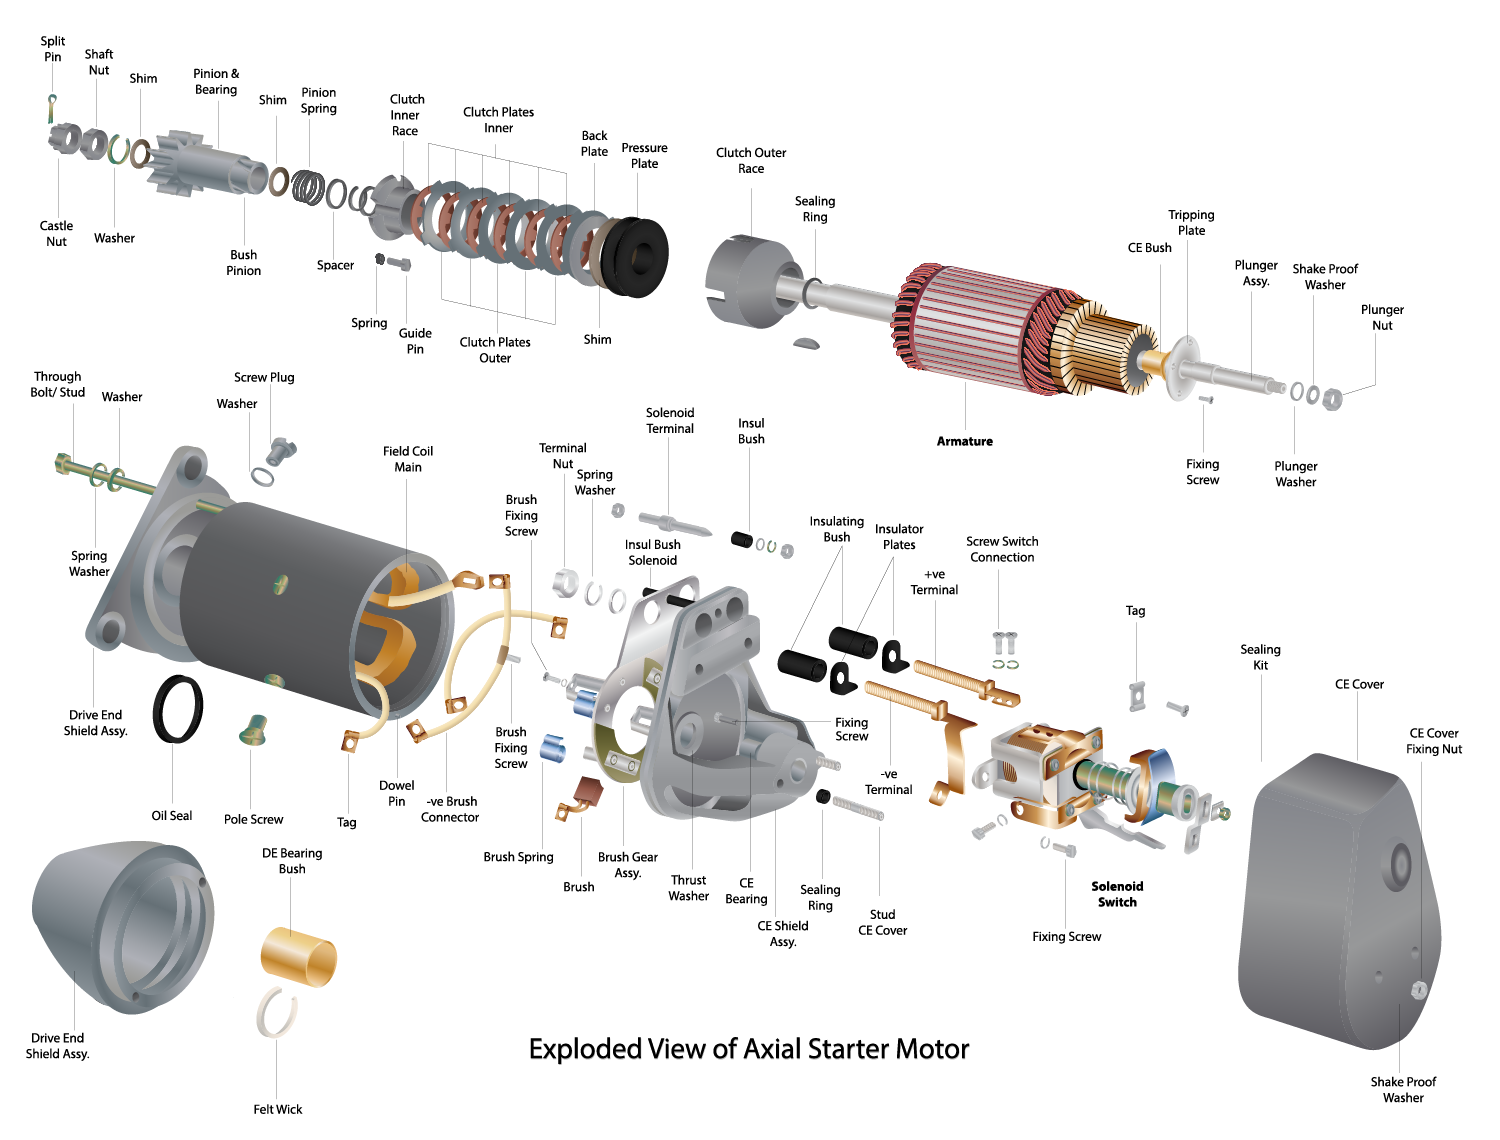
What does code behind the image look like? That depends on the complexity of the image, of course. At its simplest, we can define an image containing just a single circle in just a few lines. However, an image like the one we used in our recent competition containing many objects, text and CSS for surface shading can run to tens of thousands of lines of code that are indecipherable to a human reader.

SVG Circle

SVG code to make a circle

Complex SVG code

SVGs and XML

As well as its use on websites, SVG has made its way into common usage in XML standards commonly used for technical documentation, such as DITA and DocBook. It’s easy to see why. These XML grammars include other XML-based standards such as MathML, CALS tables and SVG within them. It’s an easy way to bring additional features to a standard without having to reinvent the wheel and means that we can process these additional features with standard tools. Even when documents are published to PDF rather than the web, it still makes sense to make use of SVG images to bring maximum flexibility in the final publication.

Spot the difference

In the past we’ve used SVG images to bring a bit of fun to our trade show stands with a spot the difference competition. Seeing visitors to our booth scratching their heads as they stare at two images side-by-side, trying to find the differences always brings a smile to our faces. But of course the main point of these competitions is to show how much easier it is to find the differences with our software.

Van Gogh’s The Bedroom

Back in 2018, we ran this competition using an SVG version of Van Gogh’s The Bedroom. In that case, 85% of people failed to find all the differences between the two images, even though there were just nine of them. Back then, using version 9 of XML Compare, we could find all the changes, but we had to write a custom pipeline using XSLT to highlight the changes using animation.

Catching change in detailed diagrams

This year, we ran the competition again to promote our XML Compare 13 release with built-in SVG comparison functionality. We used a much more complicated image this time to increase the difficulty, but we might have overdone it! Lots of you took one look at the images and decided it wasn’t worth even trying to find the differences. Even with an Apple Watch at stake. But using some clever techniques like ripping the paper in half and looking at a light through the two images or loading each image into different browser tabs and switching back and forth between them, some of you managed to get the correct answer – seventeen changes this time. Just try doing that for hundreds of images, though! Using the built-in SVG comparison in XML Compare, the result now highlights each individual change using a bounding box.

Saving time and patience with SVG comparison

The benefit of highlighting changes in SVG builds on the capabilities we already provide, enabling content owners, managers, and publishers to see exactly how their documentation changes from one version to the next. While some people choose to use this capability internally, during review cycles, for example, an increasing number of technical publishers are choosing to make a ’redline’ publication available to their end users. We also see a tremendous benefit for those content owners who need to evidence change to regulatory authorities. The ability to automatically produce a change report for regulators removes the headache of doing it manually. And we never miss a change.

If you’re using SVG in your technical documentation and you’d like to see exactly how the images change from one version to the next, download a trial of XML Compare today and give your eyes a break. And if you’d like an extra challenge, look out for another competition at a conference near you!

Keep Reading